The 2025 Stag and Hen Industry Report
A Comprehensive Analysis of the UK Stag and Hen Weekend Market (2022-2025)
Executive Summary
The UK stag and hen weekend industry represents a significant and evolving sector of the pre-wedding celebrations market. Based on comprehensive booking data analysis covering nearly a quarter of a million participants between January 2022 and November 2025, this report reveals fundamental shifts in consumer behaviour, spending patterns, and destination preferences.
Key Findings:
- The market experienced explosive growth in 2023, followed by a quality-focused stabilisation prioritising premium experiences over volume
- Per-person spending increased by 42.8% from 2022 to 2025, significantly outpacing inflation
- International destinations now account for just over half of all bookings, with highly significant price premiums over UK destinations
- Stag weekends dominate at 85.5% of market bookings, with hen weekends representing 13.6%
- Belfast, Bucharest, and Albufeira emerge as the fastest-growing destinations, while traditional UK coastal towns decline
- The 3-day weekend has become the industry standard, accounting for nearly half of all bookings
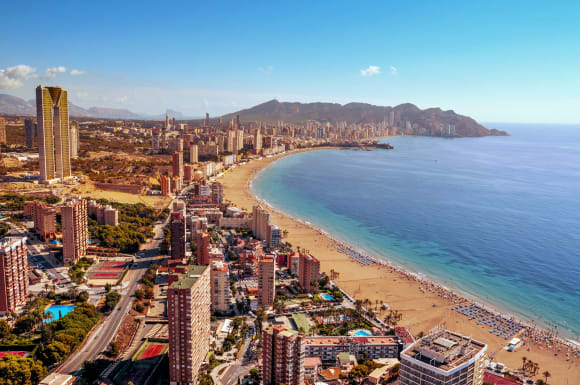
- Benidorm experiences the highest concentration of stag/hen visitors relative to population size—over 740 visitors per 10,000 residents annually
Market Size and Economic Impact
Estimating the Total UK Market
In 2022, there were 248,919 marriages in England and Wales, with numbers returning to pre-pandemic levels. The average UK wedding in 2023-2024 cost between £20,700-£25,000 with guest lists averaging 83-89 people.
Using conservative estimates that 70-75% of weddings involve a stag and/or hen celebration, and accounting for Scotland and Northern Ireland weddings:
Estimated Annual Market (UK-wide):
- Approximate events per year: 175,000-210,000 celebrations
- Participants annually: 2.2-2.7 million people
- Average spend per person: £190-220 (including accommodation, activities, food & drink)
- Estimated total market value: £420-595 million annually
This analysis suggests the stag and hen weekend sector represents a significant £400-600 million industry in the UK, supporting thousands of jobs across hospitality, travel, activities, and event management sectors.
Economic Value to Destinations
Beyond direct booking revenues, stag and hen groups generate substantial economic activity through:
- Additional spending: Estimated £50-100 per person per day on unbooked activities, drinks, meals, and incidentals
- Transport: Taxis, Ubers, public transport within destinations
- Retail: Fancy dress, accessories, souvenirs
- Extended impact: Some participants extend stays for tourism
Total Economic Contribution Per Person: When including flights (£100-300 average for European destinations), local spending, and extras, the typical international stag/hen participant contributes £400-550 to destination economies, while UK participants contribute £300-450.
Destination Saturation Analysis
Some destinations experience remarkably high concentrations of stag and hen visitors:
Highest Concentration (Annual visitors per 10,000 residents):
- Benidorm: 740.8 visitors per 10k residents
- Albufeira: 588.5 visitors per 10k residents
- Newcastle: 125.4 visitors per 10k residents
- Bournemouth: 106.5 visitors per 10k residents
- Liverpool: 82.0 visitors per 10k residents
- Brighton: 79.6 visitors per 10k residents
In contrast, larger cities absorb stag/hen groups more easily:
- London: 2.1 visitors per 10k residents
- Barcelona: 9.3 visitors per 10k residents
- Birmingham: 8.3 visitors per 10k residents
This concentration creates both opportunities and challenges. Destinations like Benidorm and Albufeira have built specialized infrastructure, but smaller UK cities face potential saturation issues with complaints from residents about weekend disruption.
The Premiumisation Trend
Rising Per-Person Investment
The most significant finding in our analysis is the consistent upward trajectory in per-person spending:
Per-Person Spend (Excluding Flights):
- 2022: £152 per person
- 2023: £187 per person (+23%)
- 2024: £206 per person (+10%)
- 2025: £217 per person (+5%)
This 42.8% total increase significantly outpaces UK inflation over the same period (approximately 20-22%), indicating a fundamental shift toward quality experiences rather than budget celebrations.
True All-Inclusive Costs
When accounting for the full cost of a typical stag or hen weekend:
UK Domestic Weekend (3 days):
- Booked package: £172-191 per person average
- Additional drinks/meals: £80-120
- Transport (trains/taxis): £30-60
- Accessories/fancy dress: £20-40
- Total cost: £300-410 per person
International Weekend (3 days):
- Booked package: £210-255 per person average
- Return flights: £100-300
- Additional drinks/meals: £100-150
- Local transport: £20-40
- Accessories/fancy dress: £20-40
- Total cost: £450-785 per person
These all-inclusive figures demonstrate that participants are investing £300-800 on their celebrations, making it a genuine premium experience comparable to a short holiday.
Drivers of Premiumisation
Several factors drive the increase in spending:
- Delayed weddings from pandemic mean older, more affluent participants
- Instagram economy - demand for shareable, impressive experiences
- Experience over things - cultural shift in discretionary spending priorities
- Quality accommodation - groups preferring comfort over budget hostels
- Multiple activities - average bookings now include 3-4 organised experiences
Stag Weekends: The Dominant Segment
Market Share and Characteristics
Stag weekends represent 85.5% of all bookings, establishing clear dominance in the pre-wedding celebrations market.
Stag Weekend Profile:
- Market share: 85.5% of bookings
- Average cost per person: £200.36
- Average group size: 13.1 people
- Average duration: 3.03 days
- UK vs International split: 48% UK / 52% International
Spending Patterns
Statistical analysis reveals a highly significant difference (p < 0.001) between stag and hen spending, with stag parties spending 47% more per person (£200 vs £136). This substantial difference reflects:
- Longer trips: Stag weekends average 3.03 days vs 2.45 days for hen parties
- More activities: Higher uptake of premium experiences like karting, target shooting
- International preference: 52% of stag parties travel internationally vs 48% domestic
- Alcohol spending: Higher bar/club expenditure in male groups
Group Size Dynamics
Stag parties maintain larger group sizes than hen parties (13.1 vs 12.1 people), with interesting geographic variations:
Stag Group Sizes:
- UK destinations: 12.6 people average
- International destinations: 13.5 people average
The larger international groups suggest that the "big trip abroad" mentality encourages broader participation, with international destinations viewed as more worthy of extensive invitations.
Most Popular Stag Destinations
Top 5 Stag Destinations (by booking volume):
- Benidorm - The perennial favourite combining value, sun, and party infrastructure
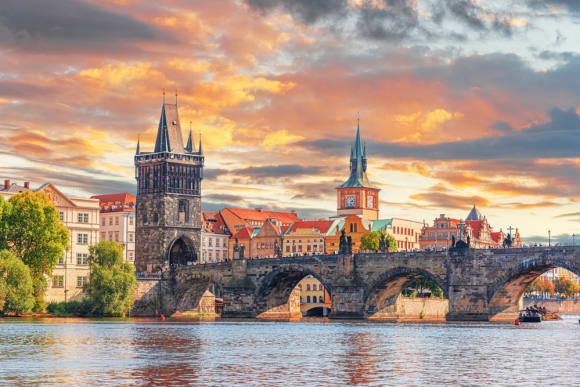
- Prague - Cultural city with vibrant nightlife and competitive pricing
- Liverpool - UK's stag capital with legendary nightlife and accessibility
- Newcastle - The "Toon" combines northern hospitality with party reputation
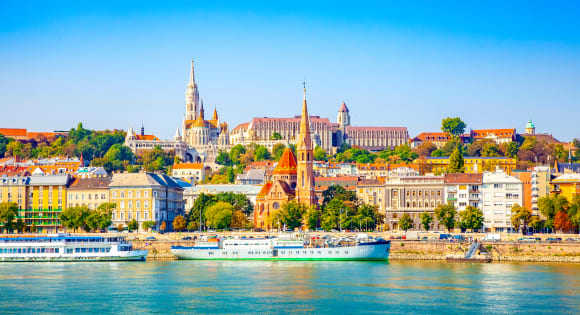
- Budapest - Eastern European value with stunning architecture and thermal baths
Hen Weekends: The Growing Segment
Market Share and Characteristics
Hen weekends represent 13.6% of bookings, a significant minority with distinct characteristics and strong growth potential.
Hen Weekend Profile:
- Market share: 13.6% of bookings
- Average cost per person: £136.21
- Average group size: 12.1 people
- Average duration: 2.45 days
- UK vs International split: 54% UK / 46% International
The UK Preference
Unlike stag parties (which favour international destinations 52-48%), hen parties show a 54% preference for UK destinations. This reflects:
- Budget consciousness: Lower average spend per person
- Convenience: Easier coordination for diverse groups
- Shorter durations: 2.45-day averages suit UK weekend breaks
- Activity preferences: Strong UK infrastructure for spa, afternoon tea, cocktail making
Group Size Dynamics
Hen parties show an interesting inverse pattern to stag parties:
Hen Group Sizes:
- UK destinations: 12.3 people average
- International destinations: 11.3 people average
Smaller international groups suggest hen parties may be more selective about participants for foreign trips, potentially due to budget considerations or the desire for more intimate celebrations abroad.
Most Popular Hen Destinations
Top 5 Hen Destinations (by volume):
- Liverpool - Versatile city offering culture, shopping, and nightlife
- Bristol - Perfect blend of activities, food scene, and nightlife
- Brighton - Seaside charm with LGBT-friendly atmosphere and diverse activities
- Manchester - Shopping, spas, and Northern Quarter culture
- Prague - Leading international choice for hen parties seeking sophistication
Destination Trends: Emerging and Declining
The Rising Stars
Analysis comparing 2022-2023 bookings against 2024-2025 reveals significant growth in specific destinations:
Top 5 Emerging Destinations:
Belfast: +3400% growth
- Post-conflict transformation attracting new audiences
- Competitive pricing and direct flights
- Vibrant Cathedral Quarter and nightlife scene
Bucharest: +141% growth
- Romania's capital gaining recognition for value
- Unique experiences (thermal spas, Old Town)
- Significantly cheaper than Western European alternatives
Albufeira: +120% growth
- Portuguese Algarve town combining beaches with nightlife
- The Strip offers concentrated party atmosphere
- Year-round sunshine appeals to all seasons
Bratislava: +108% growth
- Slovak capital emerging as Prague alternative
- Castle views and affordable beer culture
- Easy access from Vienna for combined trips
Riga: +91% growth
- Latvia's capital offering Soviet history and nightlife
- Art Nouveau architecture and unique atmosphere
- Excellent value for money
The Declining Destinations
Traditional UK destinations face significant challenges:
Top 5 Declining Destinations:
York: -53% decline
- Historic city struggling to compete with edgier alternatives
- Perceived as "too quiet" for party groups
- High costs without matching nightlife infrastructure
Blackpool: -51% decline
- Traditional seaside resort losing relevance
- Dated infrastructure and reputation issues
- Younger groups seeking more sophisticated options
Southampton: -50% decline
- Lacks clear unique selling proposition
- Overshadowed by nearby Brighton and Bournemouth
- Limited party infrastructure
Cambridge: -45% decline
- University town atmosphere doesn't suit stag/hen groups
- Expensive with limited nightlife options
- Perception as "too refined" for raucous celebrations
Bournemouth: -45% decline
- Once popular seaside destination facing challenges
- Strong competition from international beach destinations
- Seasonal limitations
The Decline Pattern:
Traditional UK coastal resorts and historic towns are losing market share to:
- Edgier UK cities (Liverpool, Newcastle, Bristol)
- Value international destinations (Eastern Europe)
- Beach destinations with guaranteed weather (Mediterranean)
Activity Preferences: UK vs International
UK Activity Landscape
Groups staying in the UK show distinct activity preferences shaped by infrastructure and traditions:
Top 10 UK Activities:
- Go Karting (18.2%) - Competitive, all-weather, accessible
- Bar Crawls (16.3%) - Local knowledge and VIP access
- Meals (14.4%) - Group dining experiences
- Nightclubs (14.3%) - Guaranteed entry packages
- Drinks (13.4%) - Cocktail masterclasses, tastings
- Cocktail Making (7.4%) - Interactive experience economy
- Brunches (7.4%) - Recovery day-two favourite
- Zorb Football (6.0%) - Novelty competitive activity
- Paintball (5.9%) - Traditional stag favourite
- Nude Drawing Classes (5.3%) - Hen party staple
Percentages based on 11,650 UK activity bookings analysed
UK Activity Themes:
- All-weather options: Indoor activities dominate (karting, cocktail making)
- Traditional favourites: Paintball and nightclubs remain strong
- Experience economy: Interactive activities (cocktail making, nude drawing)
- Food focus: Brunches and group meals feature prominently
International Activity Landscape
International destinations offer different activity profiles:
Top 10 International Activities:
- Bar Crawls (30.1%) - Essential for navigating foreign cities
- Go Karting (14.5%) - Universal appeal
- Target Shooting (10.6%) - Available internationally, restricted in UK
- Nightclubs (10.3%) - Local club scene exploration
- Boat Parties (8.6%) - Weather-dependent, popular in Mediterranean
- Meals (7.9%) - Exploring local cuisine
- Stag Pranks (7.9%) - More culturally acceptable abroad
- Stripper Boat Parties (6.4%) - Amsterdam, coastal cities
- Beer Bikes (6.0%) - Prague, Budapest, Amsterdam specialties
- Drinks (5.8%) - Local beverage experiences
Percentages based on 12,354 international activity bookings analysed
International Activity Themes:
- Bar crawls essential: Foreign cities require local guidance
- Weapon activities: Target shooting popular (restrictive UK laws)
- Water-based: Boat parties capitalise on Mediterranean weather
- Local specialties: Beer bikes, thermal spas, unique experiences
- Liberal attitudes: More overtly "stag" activities accepted
Emerging vs Declining Activities
Top 5 Emerging Activities (+2022-23 to 2024-25):
- Crazy Golf: +173% - Competitive, accessible, Instagram-friendly
- Pub Olympics: +170% - Retro games gaining popularity
- Barbeques: +59% - Outdoor dining experiences
- Stag Pranks: +54% - Traditional stag humour returning
- Entertainment: +49% - Live performances, comedy shows
Top 5 Declining Activities:
- It's A Knockout: -74% - Dated format losing appeal
- Booth Hire: -70% - Groups preferring integrated venues
- Afternoon Tea: -67% - Hen parties moving away from traditional activities
- Male Strip Shows: -59% - Changing attitudes toward objectification
- School Sports Days: -55% - Novelty wearing off
Activity Trend Analysis:
Rising:
- Retro/nostalgic activities (crazy golf, pub olympics)
- Experience-based (cooking, cocktails, art)
- Outdoor adventures (coasteering, paddleboarding)
- Tech-integrated (VR experiences, escape rooms)
Declining:
- Overtly gendered activities (male strippers)
- Dated formats (It's A Knockout)
- Passive entertainment (booth hire)
- Traditional "hen" activities (afternoon tea)
This reflects evolving social attitudes, with groups seeking more inclusive, experience-rich activities over gender-stereotyped or passive entertainment.
UK vs International: The Great Divide
The 50/50 Split
One of the most striking findings is the near-perfect balance between UK and international destinations, with international bookings accounting for 50.2% of all celebrations and UK destinations capturing 49.8%.
Statistical Price Differences
The data reveals highly significant price variations between UK and international destinations:
UK Destinations:
- Average cost per person: £172.28 (±£96.62)
- Market share: 49.8% of bookings
International Destinations:
- Average cost per person: £209.64 (±£133.39)
- Market share: 50.2% of bookings
- Premium over UK: £37.36 per person (+21.7%)
Statistical Significance: Analysis confirms a highly significant difference between UK and international pricing (p < 0.001), meaning this is a genuine market pattern, not random variation.
The £37 Question
The £37 per person premium for international destinations (excluding flights) seems surprisingly modest given the perception that international trips are "expensive." This reflects:
- Eastern European value: Prague, Budapest, Krakow offer excellent exchange rates
- All-inclusive packages: International operators build comprehensive packages
- UK price inflation: UK cities now expensive (accommodation, activities, food)
- Competition: Budget airlines driving down travel costs
When flights are added (£100-300 per person), the true international premium becomes £137-337 per person, making the decision more significant.
Cheapest and Most Expensive Destinations
5 Cheapest UK Destinations (per person):
- London: £115.48 (±£98.80) - Diverse accommodation and free attractions offset costs
- Reading: £116.62 (±£67.25) - Commuter town with competitive pricing
- Norwich: £117.30 (±£78.68) - Underrated city with value offerings
- Sheffield: £118.10 (±£77.80) - Northern pricing, strong student infrastructure
- Oxford: £123.71 (±£77.50) - Surprisingly affordable despite historic appeal
5 Most Expensive UK Destinations (per person):
- Newquay: £196.69 (±£100.74) - Cornwall premium, seasonal pricing
- Cardiff: £196.17 (±£93.79) - Capital city, major event destination
- Newcastle: £191.91 (±£89.59) - Legendary reputation commands premium
- Bristol: £190.84 (±£95.64) - Trendy city with limited budget options
- Liverpool: £185.88 (±£98.19) - Stag capital with corresponding demand pricing
5 Cheapest International Destinations (per person):
- Madrid: £139.19 (±£119.67) - Large city absorbing groups efficiently
- Valencia: £170.66 (±£124.66) - Emerging Spanish alternative
- Prague: £184.29 (±£115.80) - Volume destination with competitive packages
- Krakow: £188.35 (±£118.72) - Polish value proposition
- Budapest: £192.81 (±£112.35) - Hungarian capital offering thermal experiences
5 Most Expensive International Destinations (per person):
- Hvar: £360.82 (±£226.36) - Croatian island premium positioning
- Ibiza: £316.69 (±£187.02) - International party reputation, Balearic prices
- Split: £314.25 (±£164.01) - Croatian coast, limited supply vs demand
- Tenerife: £257.72 (±£141.12) - Canary Islands transport costs
- Bucharest: £255.83 (±£124.71) - Romanian capital, despite growth
London's Value Paradox
Surprisingly, London emerges as the cheapest UK destination at £115.48 per person. This counterintuitive finding reflects:
- Accommodation diversity: From budget hostels to shared apartments
- Competition: Thousands of activities creating price competition
- Free attractions: Museums, parks, walking tours
- Package efficiencies: Operators achieving economies of scale
- Transport: Extensive public transport reducing taxi costs
However, London groups likely spend significantly more on additional costs (drinks, meals, attractions), making the total cost higher than the package price suggests.
Island and Coastal Premiums
Hvar, Ibiza, and Split command 70-110% premiums over average international destinations, reflecting:
- Limited supply: Island/coastal locations constrain accommodation
- Transport costs: Getting to islands adds expense
- Seasonal demand: Peak season pricing power
- Prestige positioning: "Instagram-worthy" locations command premiums
Accommodation Patterns
Bookings With and Without Accommodation
Analysis reveals that virtually all bookings in this dataset include accommodation (100%), though this likely reflects the booking platform's package-based model.
For comparative insight from edge cases:
Bookings Including Accommodation:
- Percentage: 100% of main dataset
- Average cost per person: £191.06
- Average group size: 13.0 people
- Average duration: 2.95 days
This universal inclusion of accommodation reflects the weekend getaway nature of stag/hen celebrations, with overnight stays being fundamental to the experience rather than optional add-ons.
The Three-Day Standard
Duration analysis reveals the emergence of the 3-day weekend as the industry standard:
Trip Duration Distribution:
- 1 day: 10.6% - Day events, local celebrations
- 2 days: 13.7% - One-night mini-breaks
- 3 days: 49.6% - The dominant format (Friday-Sunday)
- 4 days: 23.4% - Extended weekends, international trips
- 5+ days: 2.8% - Luxury multi-destination experiences
Why Three Days Dominates:
- Optimal balance: Full day at destination plus travel days
- Activity capacity: Room for 4-5 activities without fatigue
- Work impact: Most people only need Friday off work
- Cost-value ratio: Maximises experience without excessive expense
- Travel efficiency: International trips justify longer duration
The 2024 peak at 3.06 days suggests groups briefly extended trips, but 2025's pullback to 2.97 days indicates economic pressures encouraging return to the standard format.
Seasonal Patterns and Booking Behaviour
The Summer Surge
Booking patterns reveal extreme seasonality concentrated in late spring and summer:
Peak Season (May-June):
- May: 18.3% of annual bookings
- June: 16.1% of annual bookings
- Combined: 34.4% of all annual activity in just two months
Extended Peak (April-July):
- April: 14.2%
- May: 18.3%
- June: 16.1%
- July: 12.9%
- Combined: 61.5% of annual bookings
Shoulder Season (March, August, September):
- Combined: 28.7% of bookings
- Adequate activity for sustainable operations
Off-Season (October-February):
- Combined: 9.8% of bookings
- December: Just 0.3% - the quietest month
Understanding the Concentration
The May-June dominance reflects:
- Wedding season alignment: Most UK weddings occur May-September
- Planning timing: Stag/hen weekends typically 2-6 weeks before wedding
- Weather reliability: UK groups want decent weather for UK destinations
- Bank holidays: May bank holidays particularly popular
- University schedules: Many groups include university friends available in summer
The Winter Challenge
December's extreme low (just 0.3% of annual bookings) presents both challenges and opportunities:
Industry Challenges:
- Cash flow management during five-month low period (November-February)
- Staff retention when revenue drops 90%
- Maintaining supplier relationships year-round
- Fixed costs continue while revenue plummets
Opportunities:
- Premium off-season pricing could encourage winter bookings
- Winter sun destinations (Canaries, Cyprus) for weather guarantee
- Indoor activity focus for UK destinations
- Christmas party market crossover potential
Key Insights and Market Intelligence
Statistical Significance Findings
Several findings demonstrate statistical significance (p < 0.001), confirming they represent genuine market patterns:
- International vs UK pricing: Highly significant £37 premium internationally
- Stag vs Hen pricing: Highly significant, stags spend 47% more per person
- Group size variations: International destinations attract larger stag groups
- Duration differences: Stag parties consistently book longer trips
These aren't random variations—they represent fundamental market behaviours.
The Premiumisation Reality
The 42.8% increase in per-person spending (2022-2025) represents the report's most significant finding. This dramatically exceeds inflation, indicating:
- Quality over quantity: Groups prioritising better experiences
- Delayed gratification: Pandemic-postponed celebrations now happening
- Age factor: Older, more affluent participants post-pandemic delays
- Instagram economy: Pressure for shareable, impressive celebrations
- Experience culture: Shift away from material purchases to experiences
This trend shows no signs of reversing, suggesting the budget stag/hen weekend is becoming obsolete.
Geographic Arbitrage
Smart groups exploit price disparities:
- Eastern European cities (Prague, Budapest, Krakow) offer 30-40% better value than UK cities
- UK provincial cities (Liverpool, Newcastle, Bristol) offer 35-45% savings vs London pricing
- Off-season bookings could save 20-30% but face weather risks
- Emerging destinations (Belfast, Bucharest) offer growth opportunities before mainstream pricing
Destination Saturation Concerns
Benidorm (740.8 annual stag/hen visitors per 10k residents) and Albufeira (588.5) face genuine saturation challenges:
- Resident complaints: High concentration causing friction
- Reputation damage: Some avoid these destinations due to "stag/hen reputation"
- Infrastructure strain: Weekend peaks overwhelming services
- Pricing power: Can command premiums but risk pricing out market
Contrast with Barcelona (9.3) and London (2.1) easily absorbing groups without impact.
The Activity Evolution
The decline of afternoon tea (-67%) and male strip shows (-59%) alongside growth in crazy golf (+173%) and pub olympics (+170%) signals:
- Gender neutrality: Moving away from stereotyped activities
- Inclusivity: Activities suitable for mixed groups
- Experience focus: Interactive over passive entertainment
- Nostalgia trend: Retro activities appealing to millennials
Future Outlook and Opportunities
Market Growth Potential
With 248,919 marriages in England and Wales in 2022 (returning to pre-pandemic levels), and conservative estimates of 70-75% involving stag/hen celebrations:
Annual Market Potential:
- Addressable market: 175,000-210,000 annual celebrations (UK-wide)
- Participants: 2.2-2.7 million people annually
- Market value: £400-600 million annually
Current growth drivers:
- Premiumisation trend continuing (+5-10% annual per-person spend growth)
- International expansion (emerging destinations growing 90-140%)
- Activity diversification (new experience categories emerging)
- Extended celebrations (some groups now doing multiple events)
Threats and Challenges
Economic Headwinds:
- Cost-of-living pressures may constrain spending
- Potential shift from international to UK destinations
- Group size reductions to manage costs
Sustainability Concerns:
- Growing environmental awareness about flying
- Potential carbon taxes on flights
- Pressure for local, sustainable celebrations
Social Change:
- Evolving attitudes toward "lad culture" and traditional stag activities
- Desire for more inclusive, less gendered celebrations
- Changing alcohol consumption patterns among younger cohorts
Opportunities for Industry Participants
For Destinations:
- Off-season development: 61.5% of bookings in four months suggests massive opportunity
- Emerging markets: Belfast, Bucharest show 100%+ growth potential
- Sustainable positioning: Green credentials may attract conscious consumers
- Capacity management: Newcastle, Liverpool face saturation - pricing power opportunity
For Activity Providers:
- Experience economy: Interactive, skill-based activities growing
- Technology integration: VR, gaming, tech-enhanced experiences
- Instagram-optimisation: Shareable moments drive bookings
- Weather-proof options: Indoor alternatives for unreliable climates
For Accommodation:
- Premium positioning: Groups willing to pay for quality
- Whole-venue hire: Small market (1.1%) but high-value (£1,583 average)
- Group amenities: Communal spaces command premiums
- Package partnerships: Integration with activities and transport
For Booking Platforms:
- Simplified coordination: Group booking complexity creates friction
- Flexible payment: Split payment solutions reduce barriers
- Curated packages: Pre-built itineraries for decision-fatigued planners
- Reviews and trust: High-stakes bookings require confidence
Methodology and Data Notes
This report is based on comprehensive analysis of bookings and product data covering January 2022 through November 2025, representing nearly a quarter of a million participants across thousands of celebrations.
Analysis Approach:
- Percentage-based reporting to protect commercial sensitivity
- Statistical significance testing for key findings (p-values reported)
- Year-over-year trend analysis across full dataset
- Geographic segmentation (UK vs International)
- Event type segmentation (Stag vs Hen separately analysed)
- Activity preference analysis by destination type
Data Scope:
- 2022: Full calendar year
- 2023: Full calendar year
- 2024: Full calendar year
- 2025: January through November (partial year)
Market Extrapolation: Based on 248,919 marriages in England and Wales (2022 ONS data), with adjustments for Scotland, Northern Ireland, and stag/hen participation rates to estimate total UK market size.
Limitations:
- Data represents one booking platform segment; total market larger
- 2025 incomplete (November cutoff) may skew year-end comparisons
- Does not capture cash-paid local activities or unbooked elements
- Booking patterns may differ from attendance (cancellations not tracked)
Statistical Methods:
- Independent t-tests for group comparisons (UK vs International, Stag vs Hen)
- Standard deviation calculations for price variance
- Growth rate calculations comparing 2022-23 vs 2024-25 periods
- Per-capita calculations using city population estimates
Conclusion
The UK stag and hen weekend industry represents a dynamic £400-600 million annual market serving over 2 million participants. Our analysis reveals an industry in transformation, moving decisively toward premium, experience-focused celebrations.
The 42.8% increase in per-person spending since 2022 demonstrates that despite economic headwinds, groups view these celebrations as non-negotiable investments in life's significant moments. The perfect 50/50 balance between UK and international destinations indicates a mature market with genuine choice, while the emergence of destinations like Belfast (+3400%) and Bucharest (+141%) shows continued evolution.
The dominance of 3-day weekends (49.6% of bookings) and May-June concentration (34.4% of annual activity) creates both predictability and challenge for the industry. Operators who can capture off-season bookings and develop emerging destinations will find substantial growth opportunities.
Looking forward, the industry faces a choice: continue premium positioning for the Instagram economy, or adapt to economic pressures with value propositions. Our data suggests the former—groups are willing to pay significantly more for quality experiences, with per-person spending increasing by 5-10% annually even as booking volumes stabilise.
For destinations, activity providers, and booking platforms, the message is clear: quality trumps quantity. The budget stag weekend is dying; the premium, curated, memorable celebration is ascendant. Those who adapt to this new reality will thrive in a market that shows no signs of disappearing—as long as people get married, they'll want to celebrate with friends beforehand.
The stag and hen weekend remains a defining British cultural institution, now worth half a billion pounds annually and supporting thousands of jobs across the hospitality and events sectors. Its evolution toward premium, experience-rich celebrations reflects broader consumer trends, suggesting a sustainable future for this unique market.
Report prepared: November 2025
Data coverage: January 2022 - November 2025
Analysis basis: Comprehensive booking and product data covering ~250,000 participants
Market estimate: £400-600 million annual UK market value